▥
Executive Dashboards
Track essential business KPIs in one place, from revenue and transaction volumes to operational performance.
See what is happening across your business with clear dashboards, meaningful KPIs and timely reports. Bring sales, inventory and operational information together to spot opportunities and act with confidence.
Explore sales trends, compare business performance and understand category distribution at a glance.
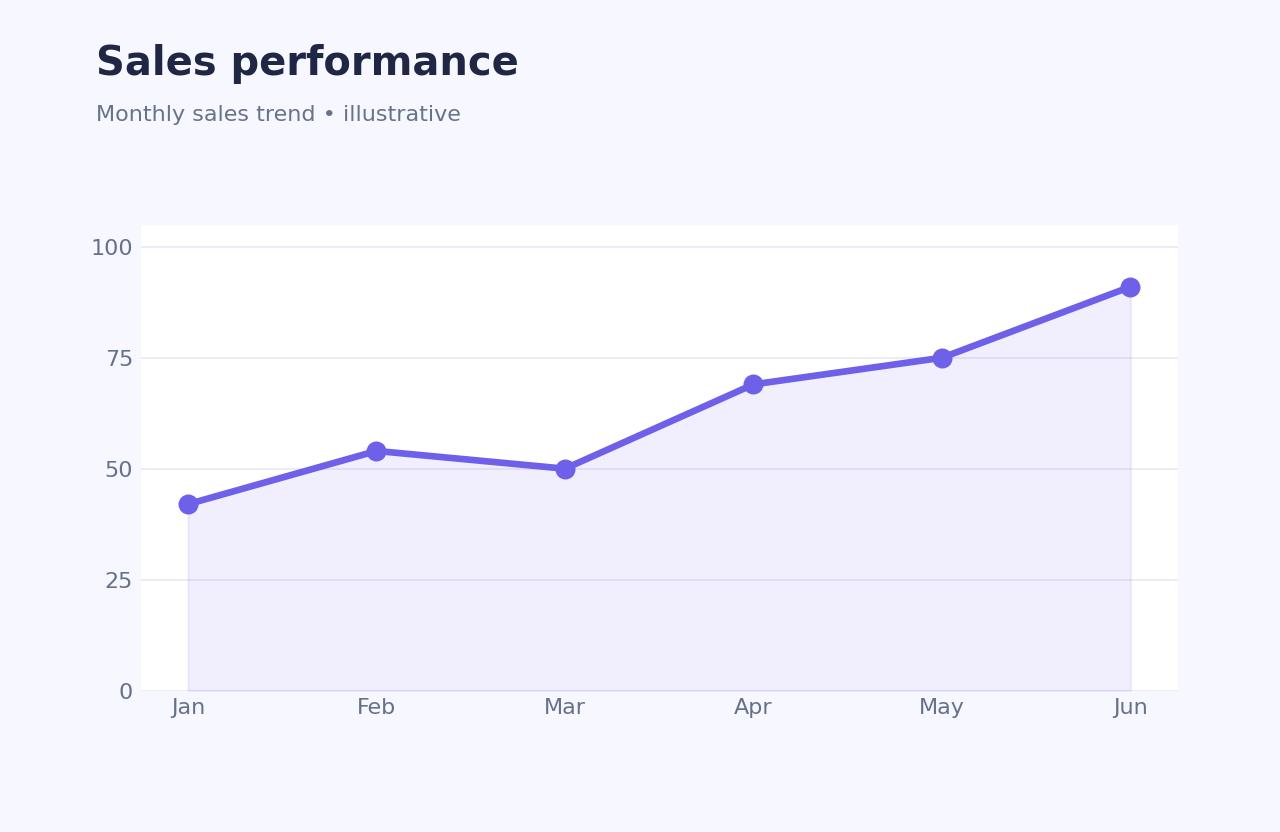
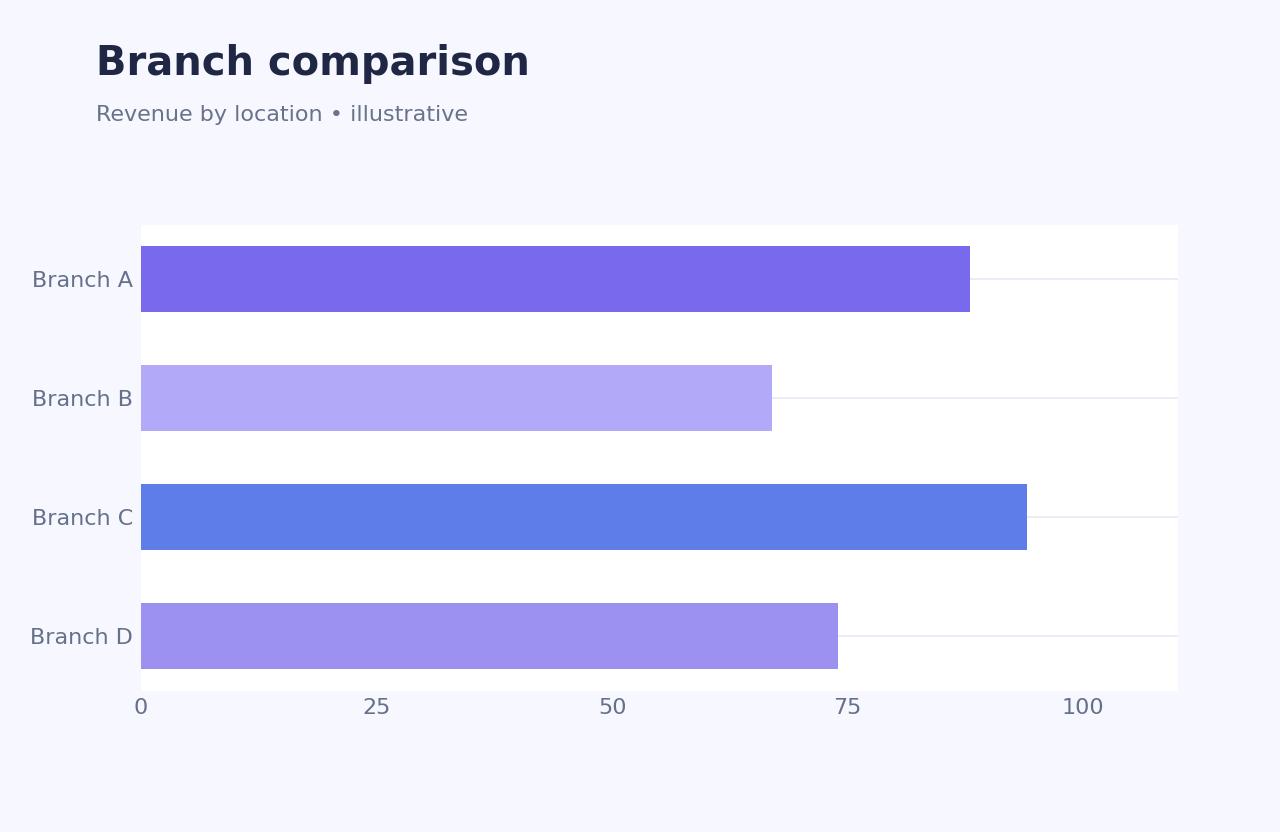
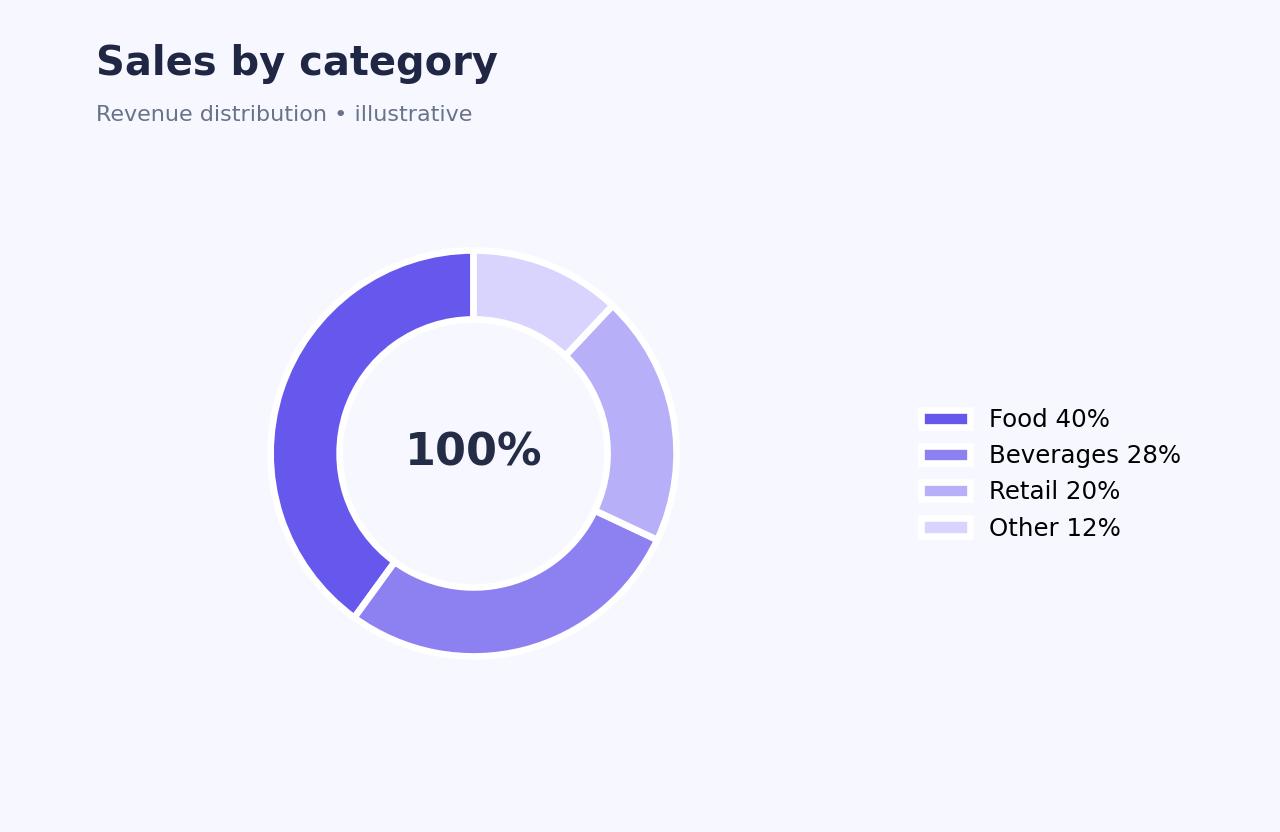
Give your teams the information they need without digging through disconnected reports.
Track essential business KPIs in one place, from revenue and transaction volumes to operational performance.
Compare sales by day, period, product, category or branch to understand trends and changing demand.
Review stock movement, fast- and slow-moving items and inventory patterns to support purchasing decisions.
Compare outlets and locations using consistent metrics, making it easier to identify strengths and gaps.
Access useful summaries and detailed reports to monitor day-to-day activities and investigate exceptions.
Focus on the indicators that matter to your business, with reporting views tailored to your operations.
Raw data is only useful when it helps you act. DAITONN Business Intelligence turns everyday transactions into clear views of sales performance, product demand, branch activity and operational trends.
Talk to Our Team ↗A simple reporting journey designed around the questions your business needs to answer.
Start with sales, stock and other operational records in your connected systems.
Group information into meaningful measures and reporting periods.
Review trends, compare performance and investigate changes.
Use the insights to plan purchasing, improve service and monitor growth.
Understand popular menu items, peak trading periods, order patterns and outlet performance.
Explore product sales, stock movement, category performance and purchasing needs.
Compare branches, monitor key indicators and review performance from a centralized view.
Tell us what you want to measure, and we'll discuss the right reporting and analytics approach for your business.
Contact Us ↗View All Solutions